"""
1.1 plt.subplots
fig,ax = plt.subplots(nrows, ncols, figsize=(width, height), dpi, sharex=False, sharey=False, **kwargs)
Parameters:
------------------------------
- fig: figure
- ax: axes or array of Axes.
- dpi: the resolution of figure.
- nrows/ncols: number of rows/columns of the subplot grid.
- sharex/sharey: bool, default: False.
Controls sharing of properties among x (sharex) or y (sharey) axes:
- figsize: the size of the created figure (Width, height) in inches (float, float).
- **kwargs: other parameters such as squeeze, width_ratios, height_ratios, subplot_kw,
gridspec_kw, etc. that are passed to the pyplot.figure call
"""
import matplotlib.pyplot as plt
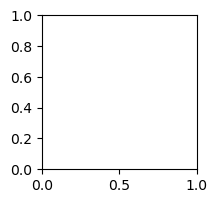
# generate a single axes figure (output 1).
fig, ax = plt.subplots(1,1, figsize=(2, 2), dpi=100)
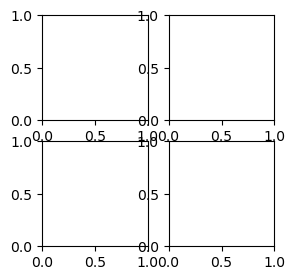
# generate a two rows and two columns axes fugure (output 2).
# ax[0] (1st row, 1st coloumn), ax[1] (1st row, 2nd coloumn) (1st row, 1st coloumn), ax[2], ax[3] represent each axes.
fig, ax = plt.subplots(2,2, figsize=(3, 3), dpi=100)
# initialize the axes.
config = {"font.family":'Helvetica'}
plt.subplots_adjust(wspace = 0.1,hspace = 0.1)
plt.rcParams.update(config)
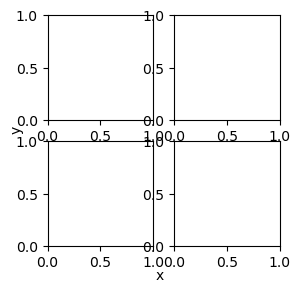
# generate a two rows and two columns axes fugure.
# ax1 (1st row, 1st coloumn), ax2 (1st row, 2nd coloumn) (1st row, 1st coloumn), ax3, ax4 represent each axes.
fig, ([ax1,ax2],[ax3,ax4]) = plt.subplots(2,2, figsize=(3, 3), dpi=100)
# all the ases share the same x and y label (output 3).
fig.text(0.5, 0, 'x', ha='center')
fig.text(0, 0.5, 'y', va='center',rotation='vertical')
"""
1.2 plt.figure
fig = plt.figure(figsize=None, dpi=None, facecolor=None, edgecolor=None, frameon=True, **kwargs)
Parameters:
------------------------------
- fig: figure
- dpi: the resolution of figure.
- figsize: the size of the created figure (Width, height) in inches (float, float).
- dpi:the resolution of the figure in dots-per-inch.
- facecolorcolor: the background color.
- edgecolorcolor: the border color.
- frameonbool, default: True. If False, suppress drawing the figure frame.
- **kwargs: additional keyword arguments are passed to the Figure constructor.
------------------------------
Useful for iteratively figure plotting.
"""
import matplotlib.pyplot as plt
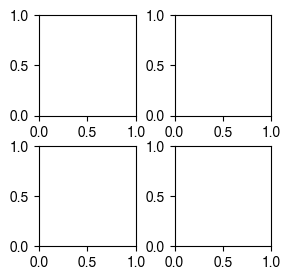
# plot a 2*2 axes figure with 100 dpi (output 1).
fig = plt.figure(figsize=(3,3), dpi=100)
config = {"font.family":'Helvetica'}
plt.subplots_adjust(wspace =0.4,hspace =0.3)
plt.rcParams.update(config)
for i in range(4):
ax = fig.add_subplot(2,2,i+1)
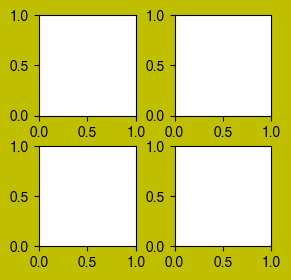
# plot a 2*2 axes figure with 100 dpi, yellow face and edgecolor (output 2).
fig = plt.figure(figsize=(3,3), dpi=100, facecolor="y", edgecolor="y")
config = {"font.family":'Helvetica'}
plt.subplots_adjust(wspace =0.4,hspace =0.3)
plt.rcParams.update(config)
for i in range(4):
ax = fig.add_subplot(2,2,i+1)
Left: output 1; Right: output 2.
"""
1.3 plt.figure & GridSpec
gs = gridspec.GridSpec(nrows, ncols)
A grid layout to place subplots within a figure.
Parameters:
------------------------------
- nrows/ncols: the number of rows and columns of the grid (int).
- other parameters: https://matplotlib.org/stable/api/_as_gen/matplotlib.gridspec.GridSpec.html
- detailed tutorial: https://matplotlib.org/3.5.0/tutorials/intermediate/gridspec.html
------------------------------
Useful for plotting irregular axes.
Useful for iteratively figure plotting.
"""
import matplotlib.pyplot as plt
from matplotlib import gridspec
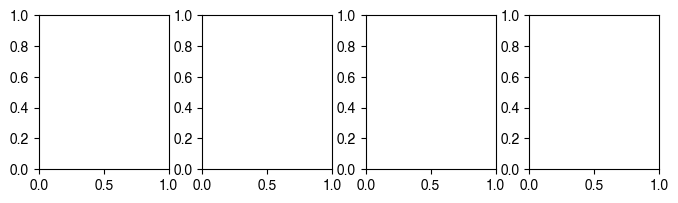
# plot a 1*4 axes figure with 100 dpi using GridSpec
fig = plt.figure(figsize=(8,2), dpi=100)
gs = gridspec.GridSpec(2, 8)
config = {"font.family":'Helvetica'}
plt.subplots_adjust(wspace =0.7,hspace =0.1)
plt.rcParams.update(config)
# can also use interative loop to generate axes.
ax1 = plt.subplot(gs[0:2, 0:2])
ax2 = plt.subplot(gs[0:2, 2:4])
ax3 = plt.subplot(gs[0:2, 4:6])
ax4 = plt.subplot(gs[0:2, 6:8])
2. Axes parameters setting
"""
2.1 set axes parameters
"""
import matplotlib.pyplot as plt
import matplotlib.ticker as mtick
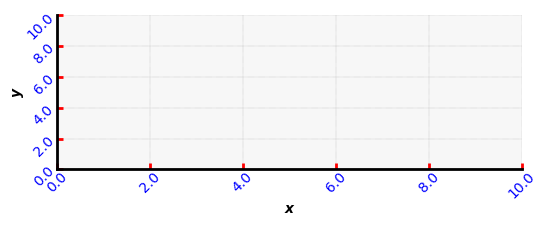
fig,ax = plt.subplots(figsize=(6,2), dpi=100)
# x-axis, y-axis label.
ax.set_xlabel('x', fontsize=10, fontweight = 'bold', fontstyle='italic', labelpad = 0.5)
ax.set_ylabel('y', fontsize=10, fontweight = 'bold', fontstyle='italic', labelpad = 0.5)
# tick parameters setting.
"""
ax.tick_params(axis='both', **kwargs)
The parameters include:
(1) axis: {'x', 'y', 'both'}, default: 'both'. The axis to which the parameters are applied.
(2) which: {'major', 'minor', 'both'}, default: 'major'. The group of ticks to which the parameters are applied.
(3) direction: {'in', 'out', 'inout'}. Puts ticks inside the Axes, outside the Axes, or both.
(4) length: float. Tick length in points.
(5) width: float. Tick width in points.
(6) color: Tick color.
(7) pad: float. Distance in points between tick and label.
(8) labelsize: float or str. Tick label font size in points or as a string (e.g., 'large').
(9) labelcolor: Tick label color.
(10) colors: Tick color and label color.
(11) zorder: float. Tick and label zorder.
(12) bottom, top, left, right: bool. Whether to draw the respective ticks.
(13) labelbottom, labeltop, labelleft, labelright: bool. Whether to draw the respective tick labels.
(14) labelrotation: float. Tick label rotation
"""
# Examples
ax.tick_params(labelsize=8)
ax.tick_params(axis = 'x',labelsize=8)
ax.tick_params(axis='both', which='major', direction='in', length=4, width=2,
color='red', pad = 0.1, labelsize=10, labelrotation=45, labelcolor = "blue",
bottom = True, top = False, left = True, right = False,
labelbottom = True, labeltop = False, labelleft = True, labelright = False)
# set the visiblity of axis
ax.spines[['top', 'right']].set_visible(False)
ax.spines[['bottom','left']].set_linewidth(2)
# set xlim and ylim and display the same number of decimal places.
ax.set_xlim(0,10)
ax.set_ylim(0,10)
ax.xaxis.set_major_formatter(mtick.FormatStrFormatter('%.1f'))
ax.yaxis.set_major_formatter(mtick.FormatStrFormatter('%.1f'))
# set the facecolor and grid.
ax.set_facecolor((0,0,0,0.03))
ax.grid(color='gray', linestyle=':', linewidth=0.3)
3. Legend setting
# common settings
ax.legend(loc='upper right',fontsize=12, facecolor= 'none',edgecolor = 'none',bbox_to_anchor=(2.0, 0.7), ncol = 2, columnspacing = 0.4)
# remove legend
ax.legend_.remove()
# sometimes we need to re-define the legend as the alpha or other parameter settings in the figure.
handles, labels = ax.get_legend_handles_labels()
k = 0
new_handles = []
for handle in handles:
new_handle = plt.Line2D([], [], ls = "none", marker='o', color = original_handle_colors[k], markersize = 8, alpha = 1)
new_handles.append(new_handle)
k = k+1
legend = ax.legend(handles=new_handles, labels=labels,loc = 'lower right',fontsize=8.5, facecolor= 'none',edgecolor = 'none',bbox_to_anchor=(1.,0))